Selected engineering work

Projects &
Portfolio.

Where telecommunications expertise meets data science and artificial intelligence.

Explore three flagship case studies spanning RF optimization leadership, analytical automation and decision-oriented Customer Experience Management.

03Flagship studies
RAN → AIEngineering spectrum
CEMBusiness outcome
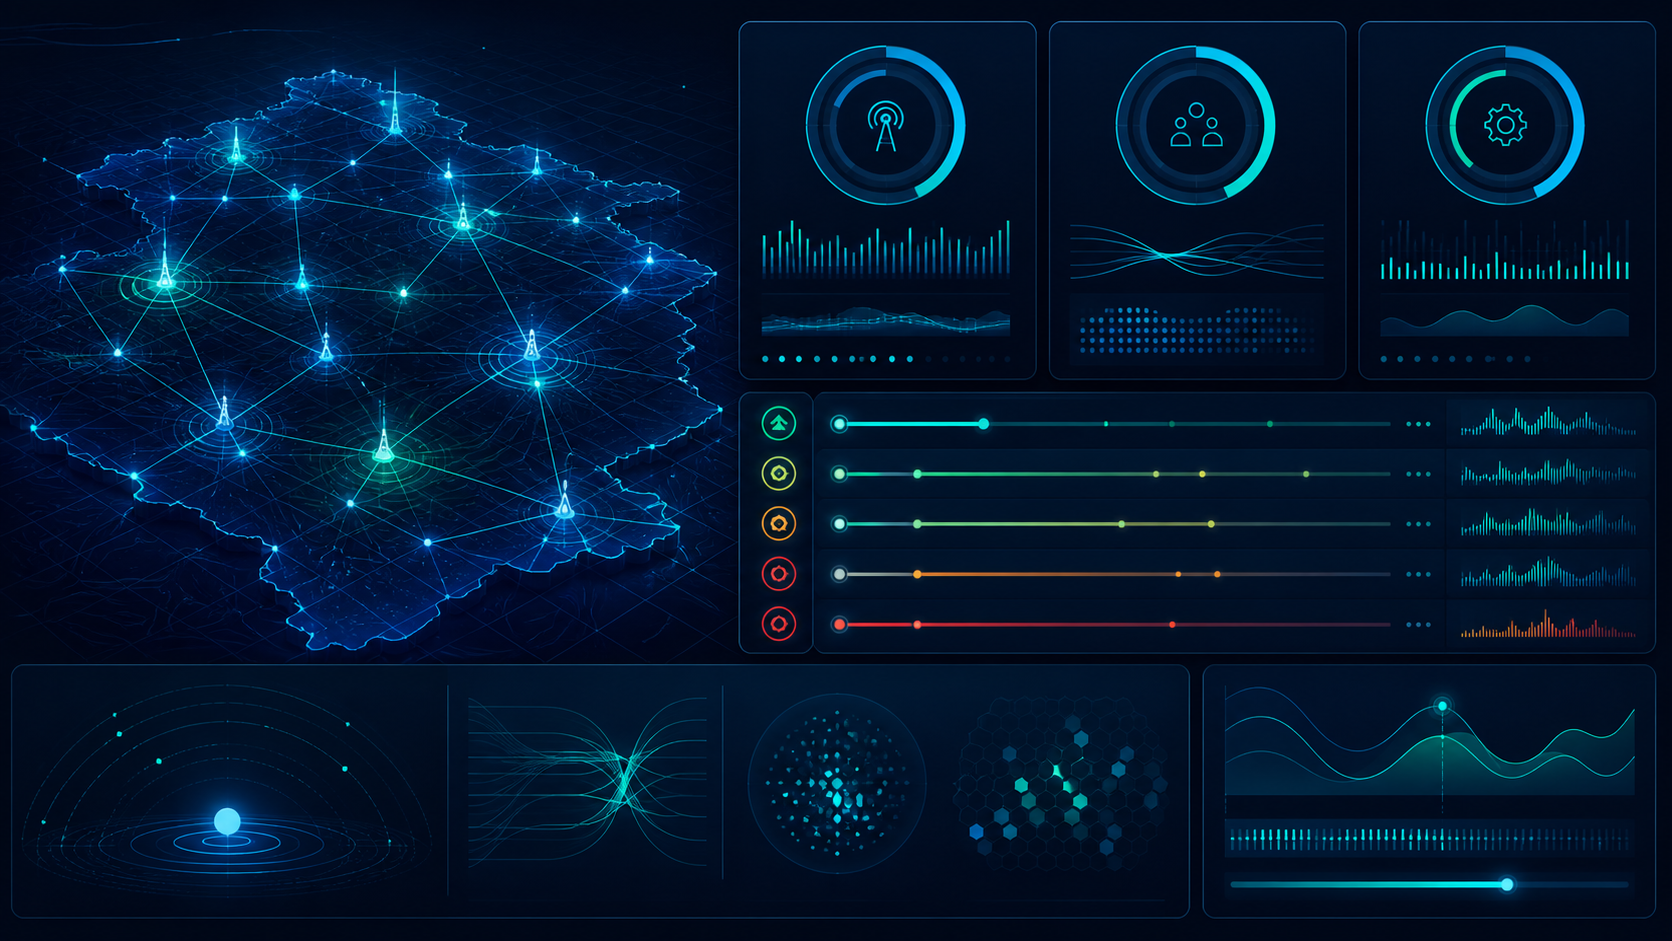
Chanont Wankaew telecom data analytics portfolio visual
TELECOM INTELLIGENCE / PROJECT INDEX

01 / PROFESSIONAL DELIVERY

Systematic Worst Cell Remediation & Radio KPI Control

3G / 4G / 5G NR
EXECUTIVE SUMMARY

A disciplined engineering workflow that connected cell-level evidence to prioritized optimization actions.

Portfolio-safe reconstruction based on verified delivery methods. No operator, subscriber, site-identifying or confidential KPI data is displayed.

Discuss this capability
DATA-SAFE EXPLANATORY MOCKUP● ENGINEERING VIEW
Abstract data-safe workflow visual: telecom signal intake flows through RF diagnosis, engineering parameter action, KPI validation and customer-experience outcome.
Systematic Worst Cell Remediation & Radio KPI Control — visual evidenceSanitized visual summary of the engineering method.

Quick take

Business problem
Recurring sector degradation and customer-impact risk.
Engineering method
RF diagnosis, parameter and physical configuration review.
Deliverable / evidence
A prioritized remediation workflow and KPI control loop.
CEM relevance
Directs engineering attention to the greatest service risk.

STAR / DELIVERY NARRATIVE

A Top 40 Worst Cell control loop.

S

Situation

Dense BMA clusters showed recurring accessibility, capacity, RF-structure and mobility degradation with customer-impact risk.

T

Task

Lead cross-functional diagnosis, prioritize the remediation queue and restore each target sector toward healthy operational thresholds.

A

Action

Audit KPIs, drive tests, alarms and configuration; isolate the dominant cause; then apply matched physical or parameter actions and validate post-change.

R

Result

A repeatable evidence-to-action method that supported SLA-focused KPI control and voice-session continuity in dense urban areas.

View sanitized engineering artifacts +
01WORST-CELL TRIAGE BOARDSAFE TEMPLATE
SignalAudit lensPriority
AccessibilityRRC / E-RAB reviewInvestigate
Voice continuityVoLTE / mobility traceInvestigate
Coverage qualityDominant server / overlapInvestigate
02ROOT-CAUSE DECISION MAPSAFE TEMPLATE
DEGRADED CELLAlarm / transmissionRF structureCapacityMobilityTargeted action
03POST-CHANGE VALIDATION NOTESAFE TEMPLATE
CHANGE TYPEPhysical / parameter
VALIDATIONDrive test + KPI control
DISPOSITIONMonitor / close loop

MODERNIZATION LENS

RF depth, strengthened by data.

Today, Python, SQL and visualization can accelerate the established evidence-to-action discipline.

ESTABLISHED DELIVERYReports → isolate → validateEngineer-led control loop
+
CURRENT CAPABILITYPython & SQL → rank → action queueFaster prioritization

Forward-looking capability statement; these components are not represented as a production deployment for this historical project.

TECHNOLOGIES & TOOLS

Huawei U2000iManager PRSGENEX AssistantActix AnalyzerTEMSNemo AnalyzeMapInfoAtoll

02 / APPLIED ENGINEERING & RESEARCH

AI-Assisted Telecom Data Automation

Python · SQL · AI Pipelines
EXECUTIVE SUMMARY

A credible foundation for repeatable, AI-assisted telecom investigation—not presented as a production deployment.

Portfolio-safe reconstruction based on verified delivery methods. No operator, subscriber, site-identifying or confidential KPI data is displayed.
Discuss this capability
DATA-SAFE EXPLANATORY MOCKUP● ENGINEERING VIEW
Abstract data-safe visual of telecom telemetry flowing through Python and SQL preparation, AI-assisted investigation and a prioritized engineering action queue.
AI-Assisted Telecom Data Automation — visual evidenceSanitized visual summary of the engineering method.

Quick take

Business problem
Manual investigation can hide high-value issues in noisy engineering data.
Engineering method
Python and SQL preparation with telecom-domain investigation logic.
Deliverable / evidence
A repeatable analysis pipeline and action queue concept.
CEM relevance
Makes evidence easier to prioritize for engineering follow-up.

SANITIZED ANALYSIS ARTIFACT

INPUTTelemetry + logs
PREPARESQL + Python
INVESTIGATEFailure signals
OUTPUTAction queue

Portfolio-safe investigation template showing how raw engineering evidence can be structured before follow-up.

CONTEXT & SCOPE

Telecom data-analysis work reinforced by 340+ days of structured, self-directed AI and data-science development.

THE CHALLENGE

Reduce manual analysis effort, structure raw engineering evidence and make high-value network issues easier to separate from background noise.

KEY ACTIONS & DELIVERABLES

  1. 01Applied SQL- and Python-based workflows to investigate BMA network-performance bottlenecks.
  2. 02Connected telecom domain logic with data preparation and analytical automation.
  3. 03Studied machine-learning applications through Super AI Engineer Season 6 and a practical data-to-insight hackathon.
  4. 04Structured a modern solution approach using FastAPI, Docker, prompt engineering and RAG concepts.

TECHNOLOGIES & TOOLS

PythonPandasNumPySQLFastAPIDockerRAGPrompt Engineering

03 / PORTFOLIO CASE STUDY

Interactive Network Performance & CEM Dashboards

Power BI · Power Query · Data Storytelling
EXECUTIVE SUMMARY

A decision-oriented dashboard blueprint grounded in verified analytics training and telecom-domain experience.

Portfolio-safe reconstruction based on verified delivery methods. No operator, subscriber, site-identifying or confidential KPI data is displayed.
Discuss this capability
DATA-SAFE EXPLANATORY MOCKUP● ENGINEERING VIEW
Abstract data-safe CEM dashboard visual showing regional network health, issue prioritization and an executive decision view.
Interactive Network Performance & CEM Dashboards — visual evidenceSanitized visual summary of the engineering method.

Quick take

Business problem
Complex RF telemetry needs a decision-ready form for multiple audiences.
Engineering method
Power Query transformation, information architecture and data storytelling.
Deliverable / evidence
A dashboard blueprint with regional drill-down and issue prioritization.
CEM relevance
Bridges operational evidence and executive customer-experience decisions.

CEM EXECUTIVE VIEW / BLUEPRINT

REGIONAL HEALTH
KPI LENSESAccess · retainability · mobility
DECISION QUEUEPrioritize → investigate → communicate

A decision-view blueprint that separates technical drill-down from executive customer-experience priorities.

CONTEXT & SCOPE

A portfolio formulation showing how multidimensional RF telemetry, drive-test results and cell KPIs can be translated for engineering and executive audiences.

THE CHALLENGE

Make complex network evidence understandable, explorable and useful for technical prioritization and business decisions.

KEY ACTIONS & DELIVERABLES

  1. 01Defined an end-to-end Power Query transformation path for inconsistent telecom datasets.
  2. 02Designed a Power BI information architecture for regional drill-down and bottleneck analysis.
  3. 03Mapped RF parameter changes, SLA indicators and consolidation evidence into an executive narrative.
  4. 04Applied data-storytelling principles to separate operational detail from decision-level insight.

TECHNOLOGIES & TOOLS

Power BIPower QueryExcelData ModelingDashboard DesignData Storytelling

PROJECTS / COLLABORATION

Want to discuss a project
or build what comes next?

Get in touch Back to professional profile